Classroom Visualization
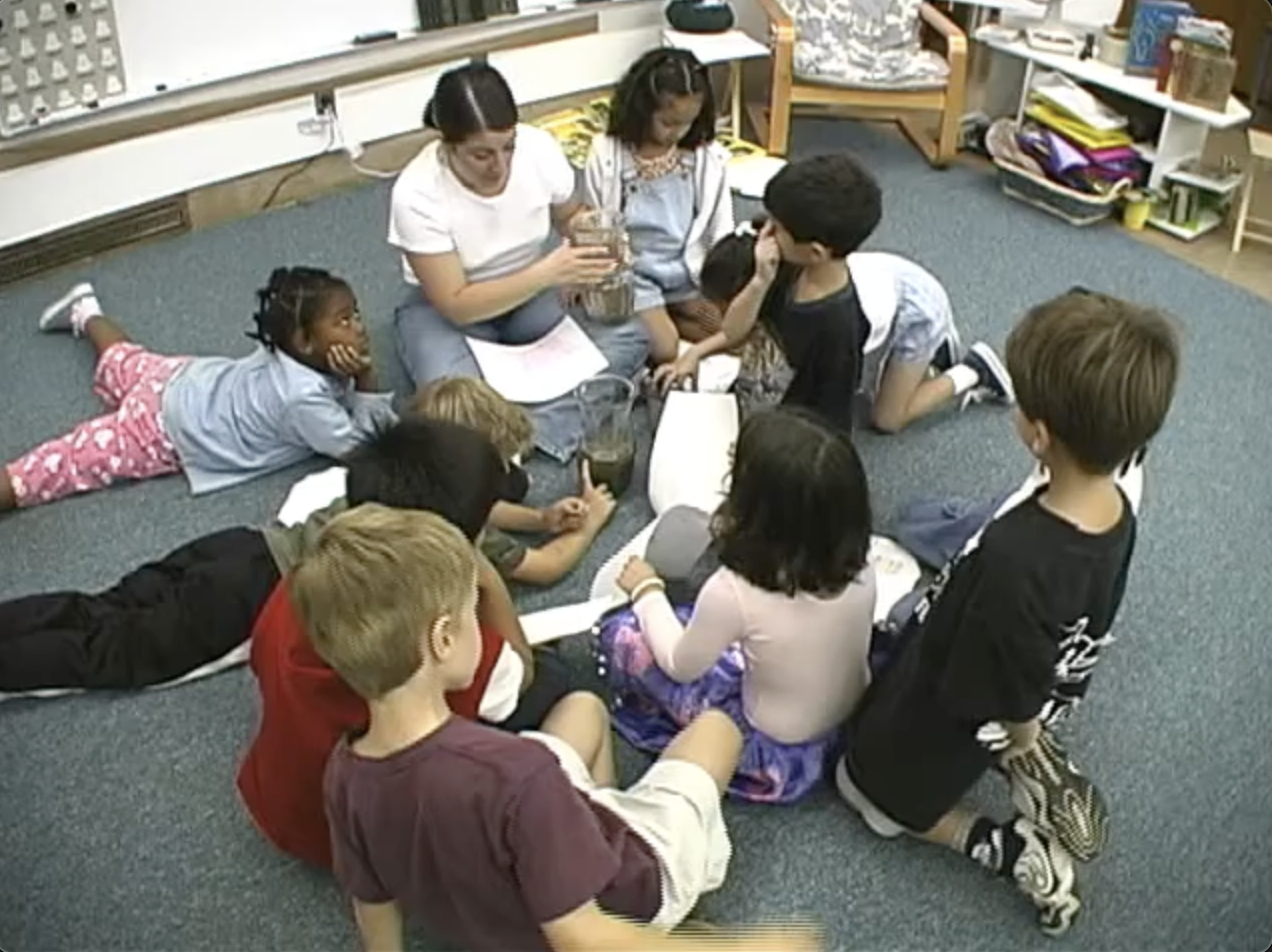
A 2-minute kindergarten activity visualized five different ways, showcasing multiple visualization techniques to explore classroom interaction in a bilingual kindergarten-first grade classroom.
View projectProjects using visualization to explore complex social phenomena, from classroom teaching to policing practices to community data literacy.
A 2-minute kindergarten activity visualized five different ways, showcasing multiple visualization techniques to explore classroom interaction in a bilingual kindergarten-first grade classroom.
View project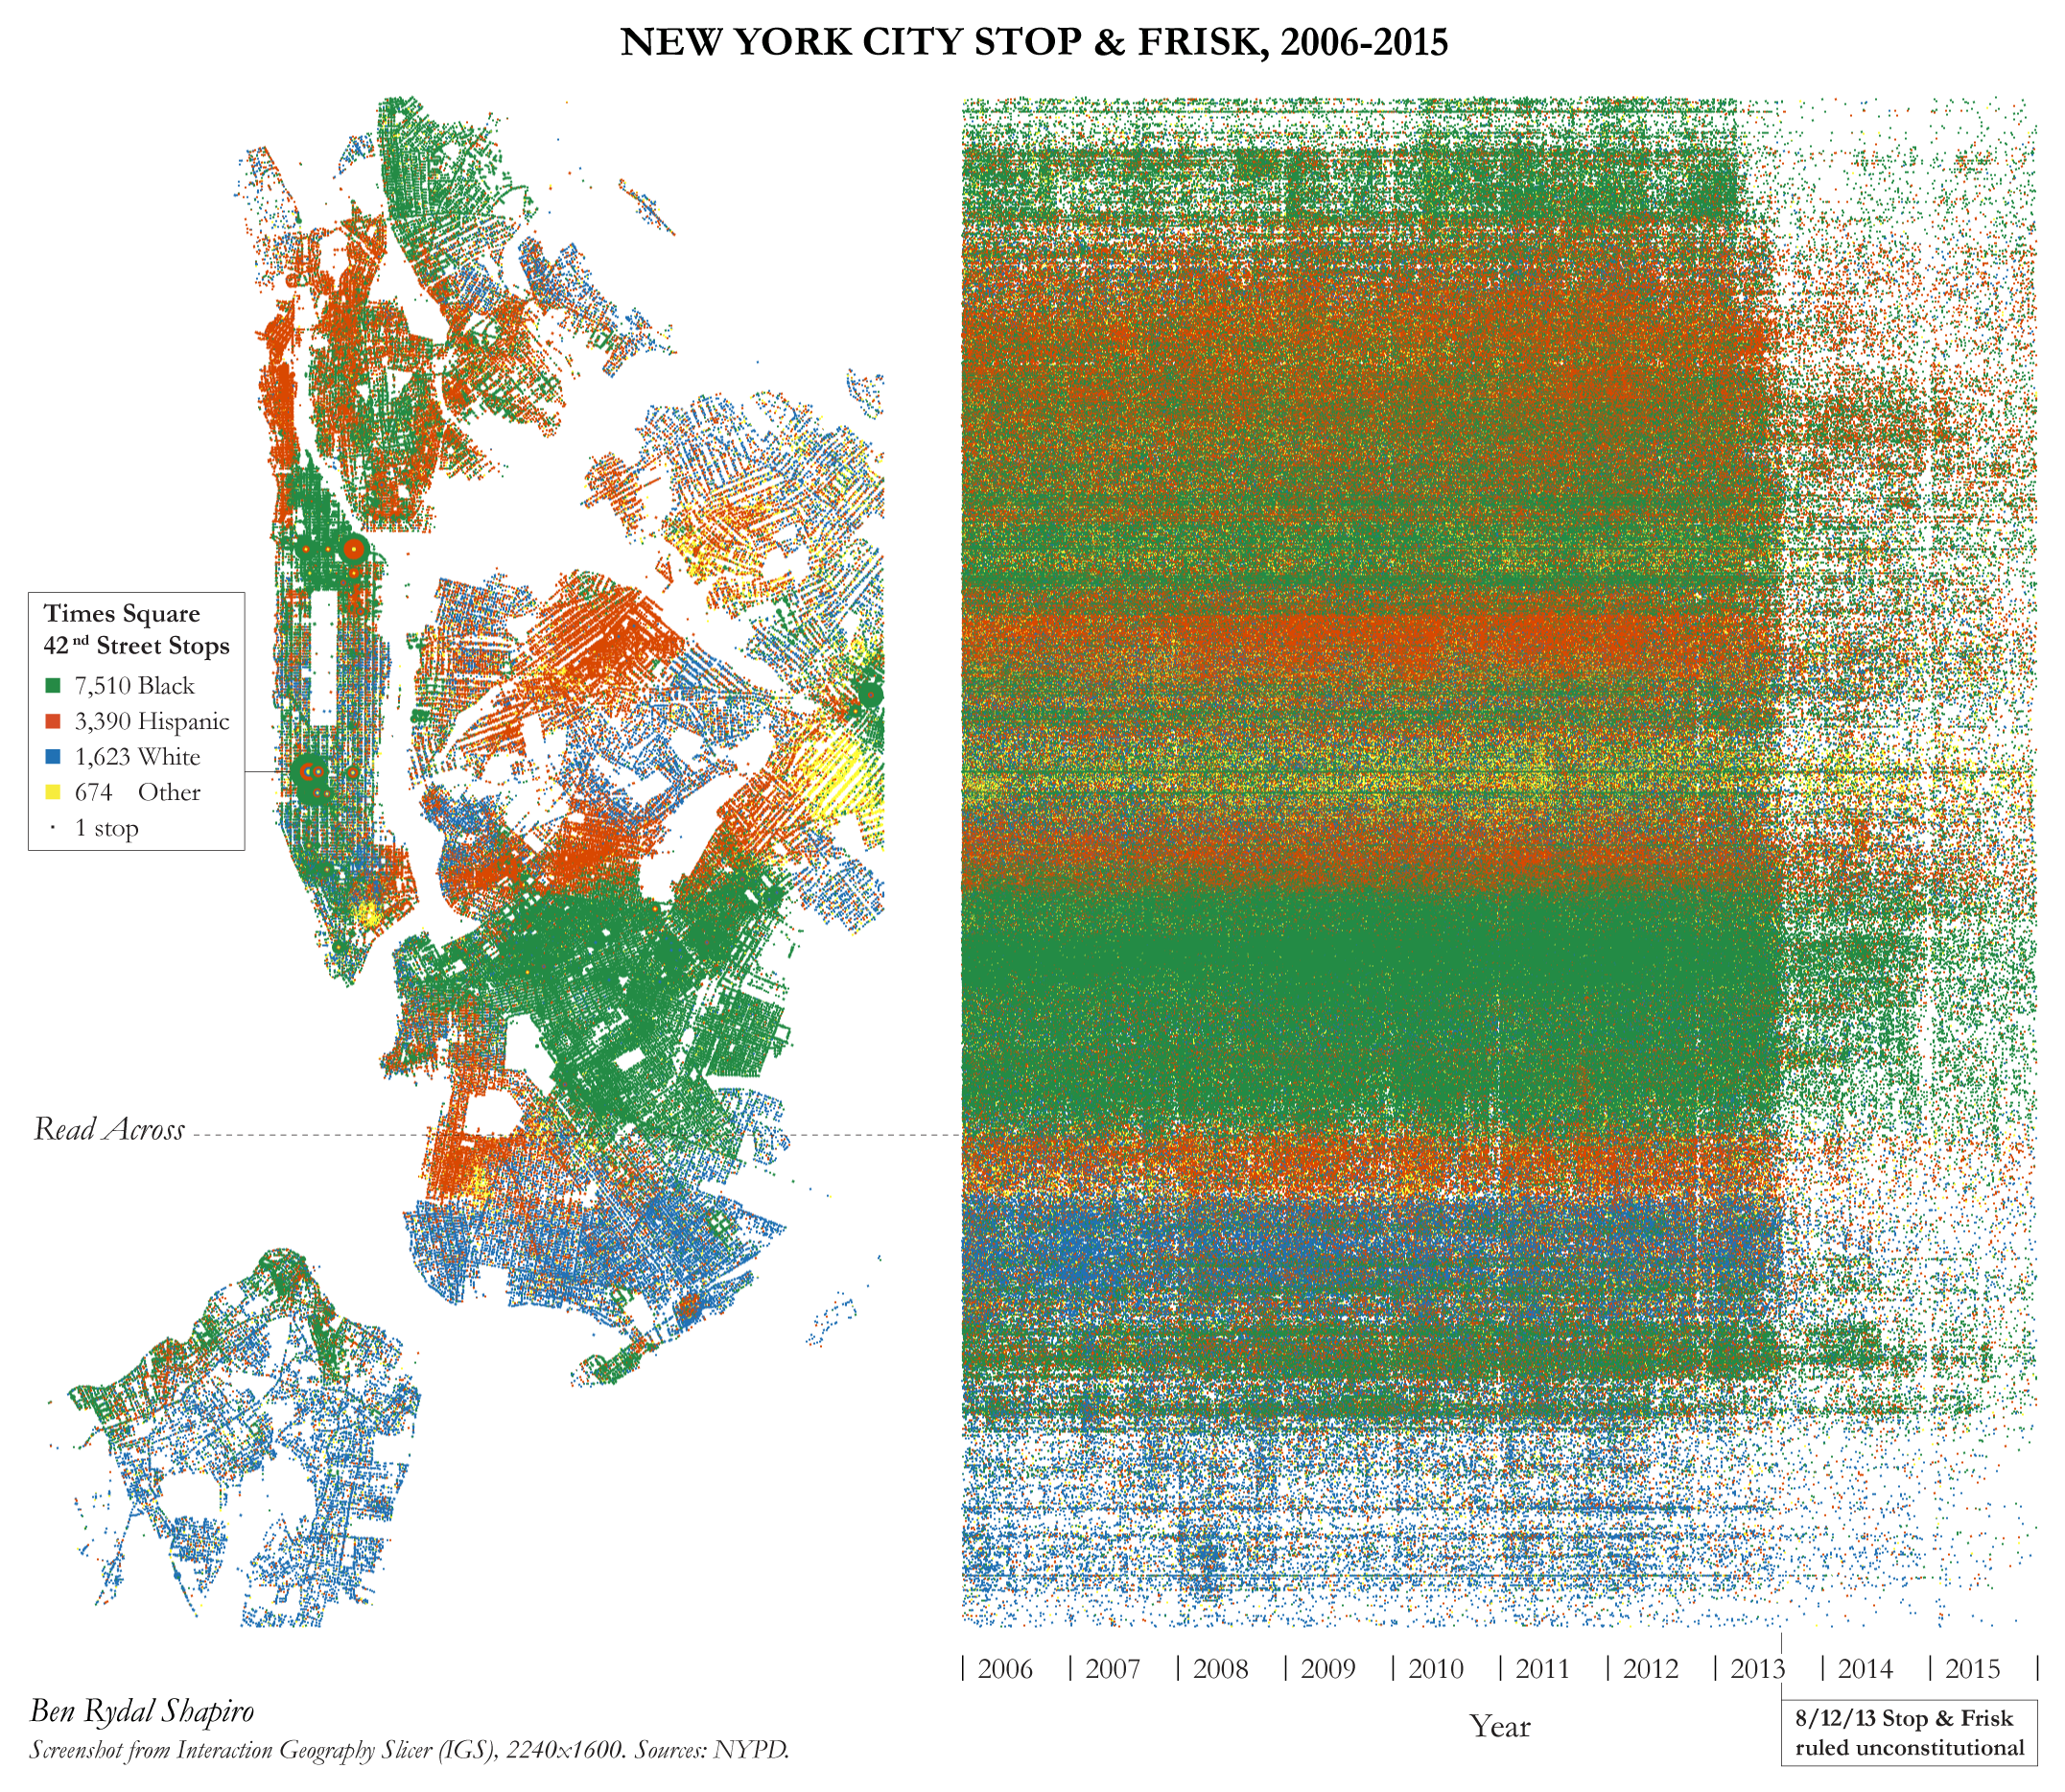
Interactive visualizations exploring patterns of street stop-and-frisk practices in New York City, revealing spatial and temporal patterns in police activity data.
View project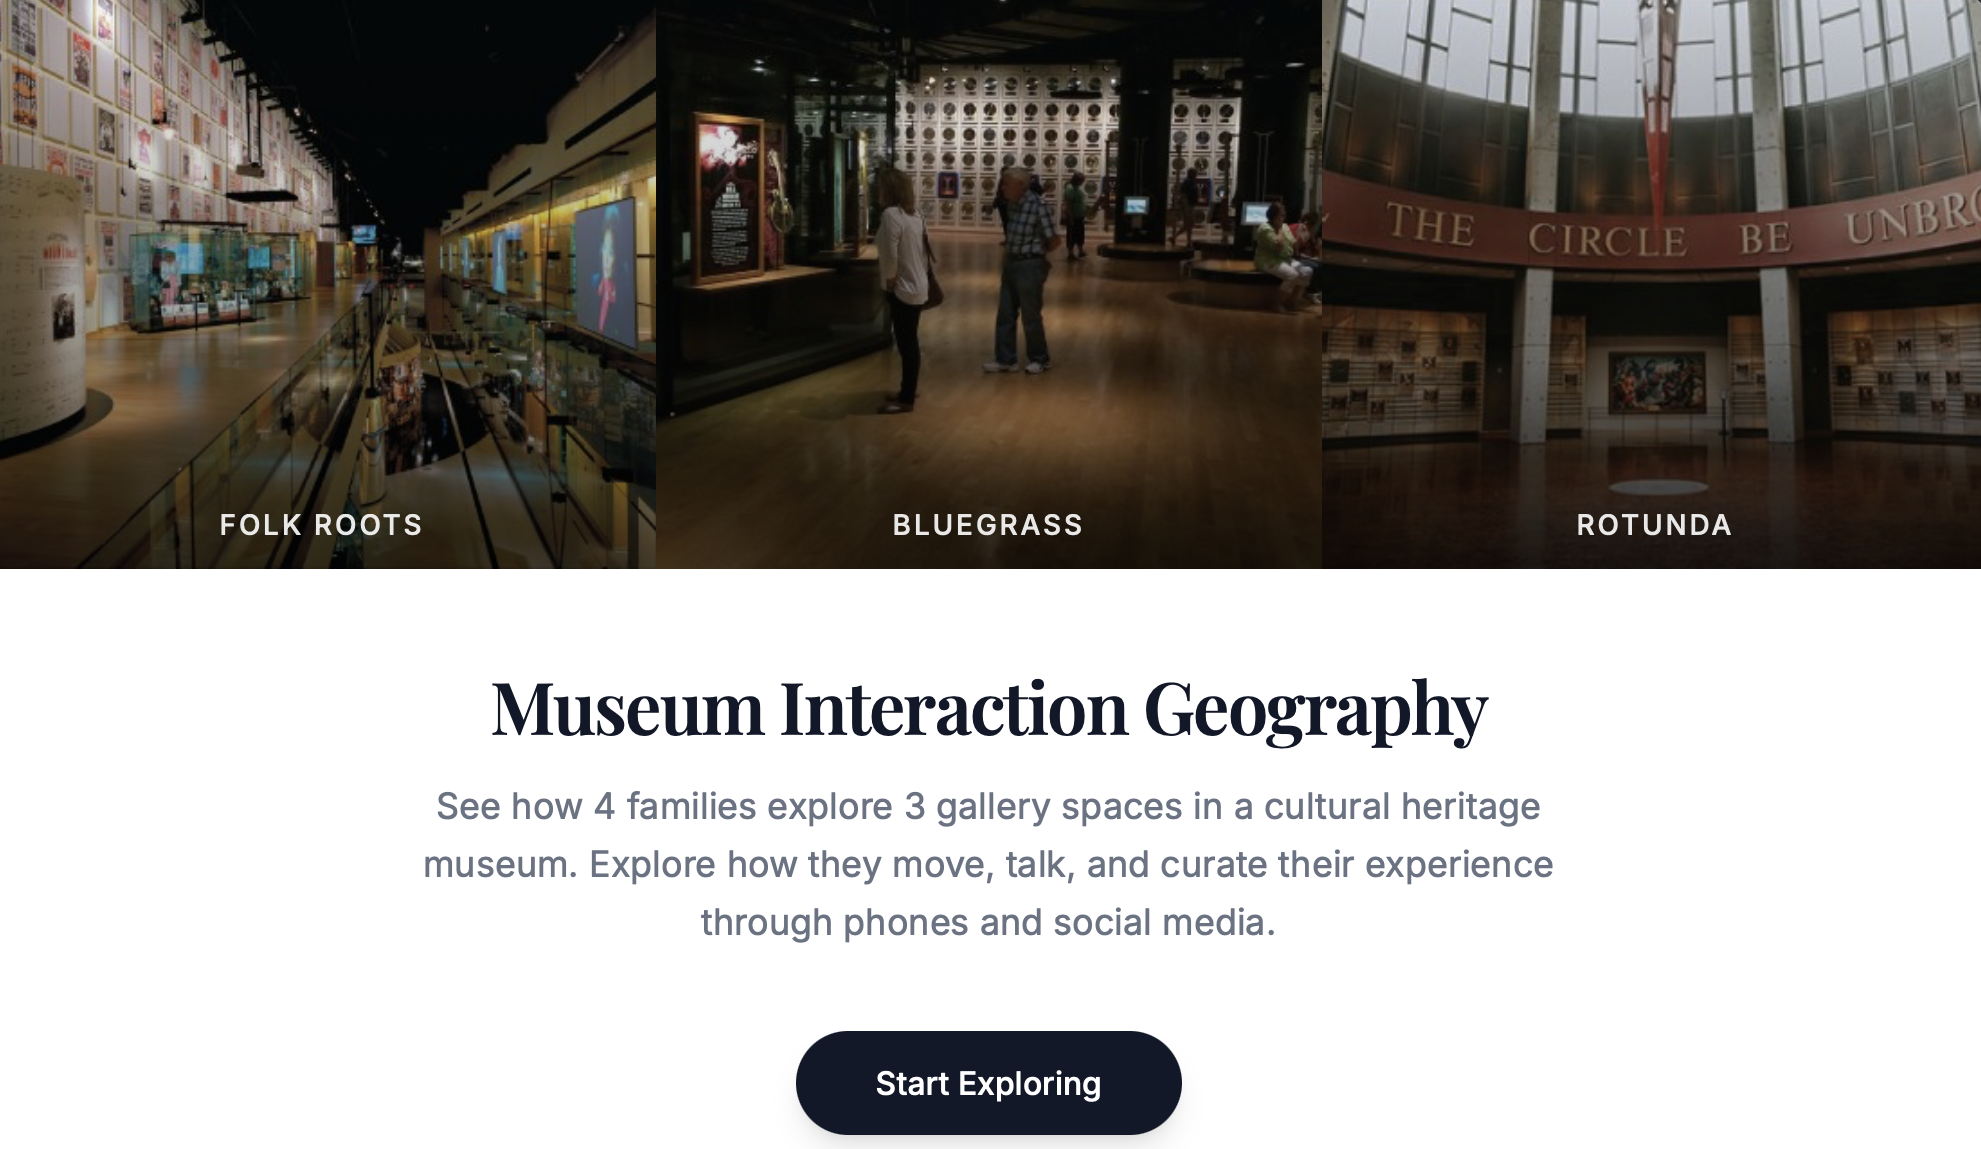
See how 4 families explore 3 gallery spaces in a cultural heritage museum. Explore how they move, talk, and curate their experience through phones and social media.
View project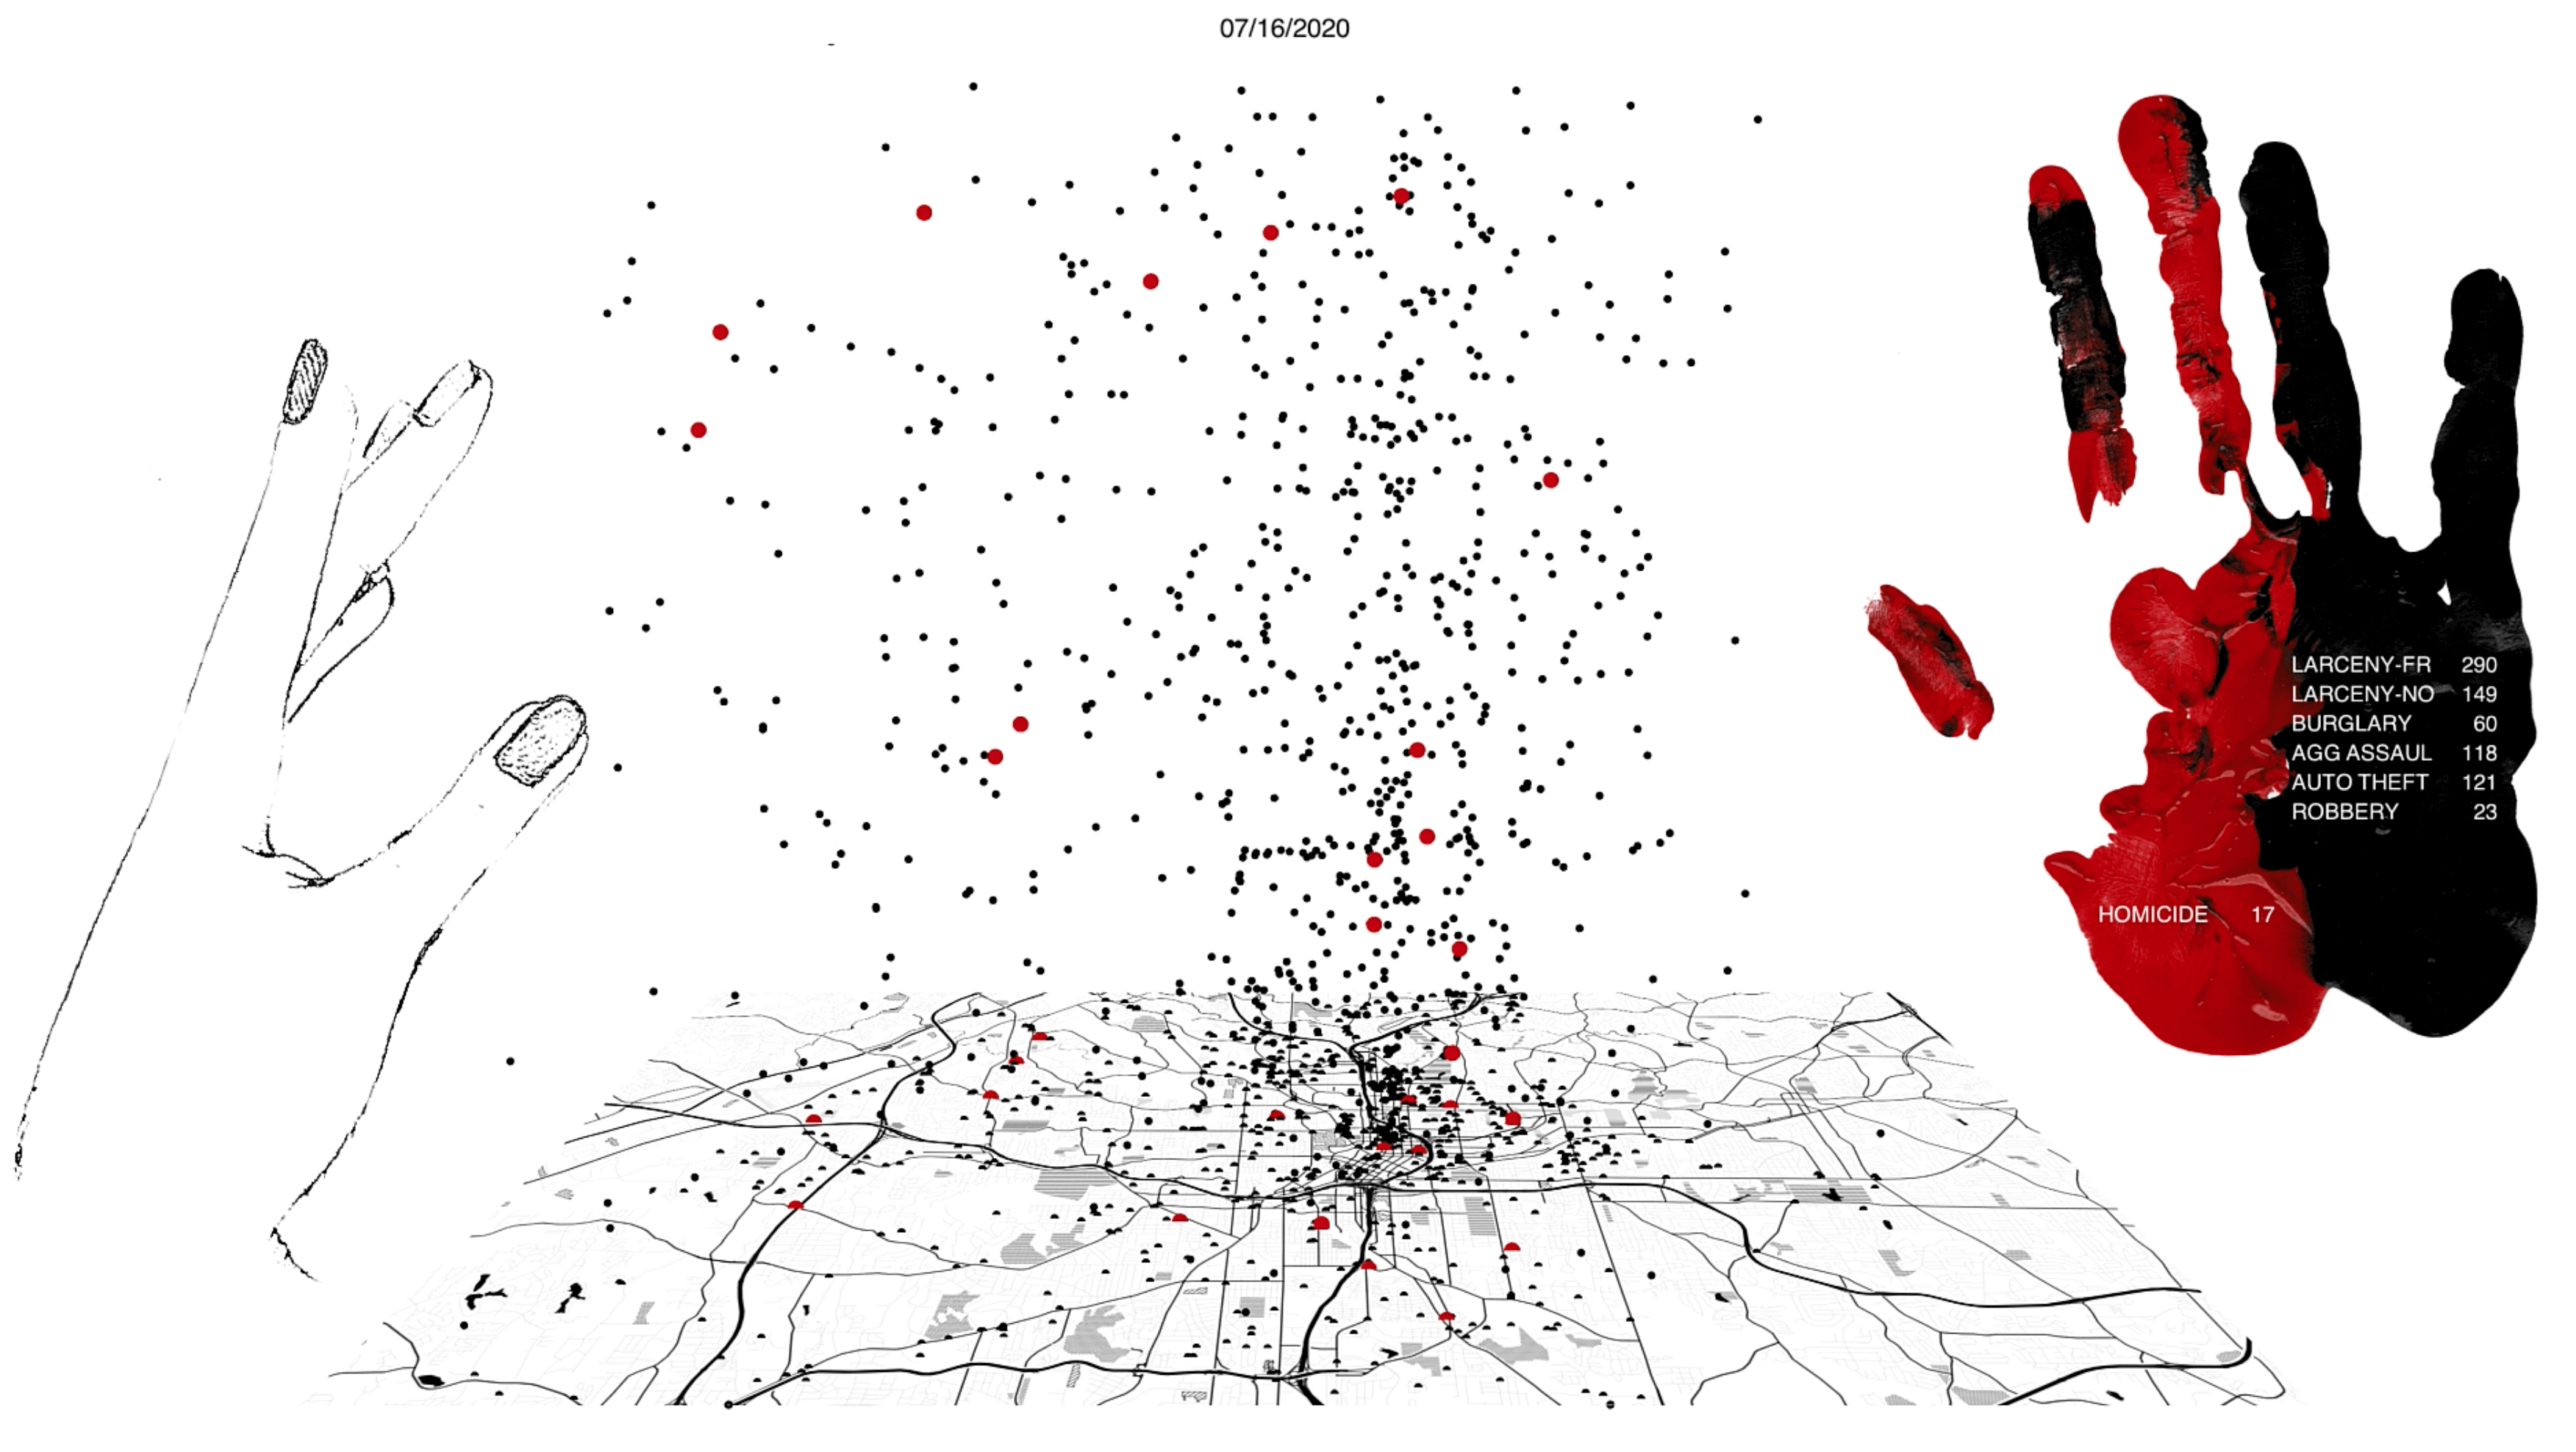
A collaborative project telling the story of Atlanta arrests through visualization, partnering criminologists and educators with underrepresented youth in computing.
View project